Value Averaging for Rebalancing
One of the key risks in investing is poor timing. The worst-case scenario is investing all at once during a market peak and holding through a downturn. However, by spreading investments across time (e.g. 1 or 2 years), one can reduce the likelihood of hitting the worst-case scenario. Paired with cost averaging through a simple mean reversion strategy like constant weighting or value averaging, returns are more likely to align closely with a fully invested 100% stock portfolio - while still cushioning against the worst outcomes.
What is value averaging (VA) anyways? VA is an investment strategy that aims to keep one’s stock portfolio aligned with a predetermined growth path. It is often presented as an alternative to dollar-cost-averaging (DCA) whereby instead of contributing a fixed amount regularly, VA adjusts the contributions based on performance: one invests more when returns fall short of the target and scales back when returns exceed it. More can be found here and here.
In this article, we look at VA as a rebalancing method and compare it to other rebalancing methods like Constant Weight (CW). For example, imagine 50/50 stocks/cash portfolio with a target annual return of 10% for the stock portion. At each review period, if stocks have grown more than 10%, we sell some to bring the portfolio back to the target and if returns are below 10%, we buy more stock to catch up to the growth path. This approach essentially adjusts our exposure to maintain a steady performance trajectory. One key difference between VA and CW is that VA can lead to an increasingly aggressive position - potentially going all-in on stocks - during prolonged market declines.
Below are 3 simulations of 30 random returns to help illustrate the idea of VA as a rebalancing method using annual growth targets of of 10%, 12% and 13%. We are assuming cash can be negative at times (i.e. we would be borrowing to buy stocks) to illustrate how VA can be more aggressive, being all-in at times and sometimes even leveraged:
Next, we compare VA with CW. The simulations below compare VA using a growth target of 12% to CW (50/50 rebalanced every year - no bands). In the first chart, “Equity Target” is based on 12% yearly growth, and in the second chart, “Equity Target” is simply 50% of the updated portfolio value (i.e. equity + cash). We hope the other fields below are self explanatory:
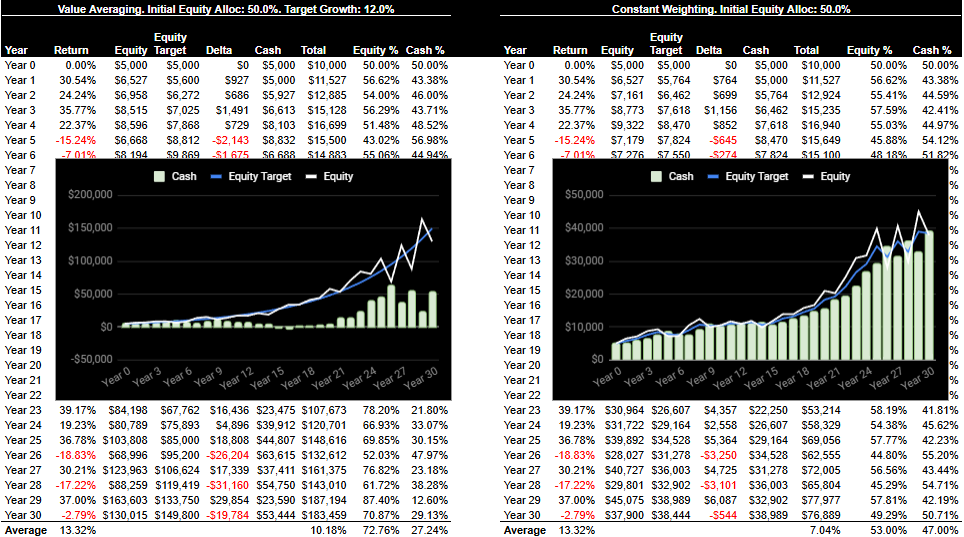
In the illustrations above, it is obvious we cannot perform a fair comparison between VA and CW because the average cash allocation for VA was 27% which was quite far from the target of 50%, whereas that of CW was much closer at 47%. For a more valid comparison, we can use more conservative growth targets, e.g. 7.5% and 6%. This makes the two more comparable as the images below illustrate:

Now we move to some real backtesting using value averaging versus constant weighting, i.e. using actual historical data instead of simulations. In all our backtests, we use weekly reviews to better capture market volatility and bigger moves. So instead of targeting, say, a 10% annual return for VA, we use a target growth of ~0.2% per week (10% ÷ 52 weeks). However, since this would lead to excessive trading due to short-term fluctuations, we only execute a trade when the suggested trading amount exceeds a minimum threshold. Through trial and error, we observed that 5% - 10% of the stock portfolio are acceptable thresholds. It all depends on the volatility of the underlying.
The first backtest below compares a 60/40 QQQ/cash portfolio rebalanced using VA and CW. You will notice that VA (left image) provided a slightly better return than CW (right image), but not on a risk adjusted basis. Cash levels got down to zero in the VA case. Also note that VA averaged 30% in cash so I chose a 70/30 split for the CW backtest for a valid comparison:
The second backtest below illustrates where VA provides a better alternative to CW. For the equity part, we will use SSO (2x SPY) instead of SPY, and will allocate to it half of what we would normally allocate to SPY. So instead of a 60/40 SPY/cash split, we will start with 30/70 in SSO/cash. For the cash part, we will use an equal split between cash (earning 0%) and gold (IAU). Finally, because the VA backtest averaged 60% in cash, we used 60% in cash for the CW backtest to make them comparable:
To further illustrate what is going on under the hood, consider a brute force backtest: $10K allocated to each of the MAGS stocks (AAPL AMZN GOOGL META MSFT NVDA TSLA), and then applying VA on each individually with a growth target of 20% / year:

This is a log of the transactions that occurred during the covid crash:

And the image below provides a deep-dive on the transactions for each individual stock (small differences with the above due to rounding):
